What does average look like?

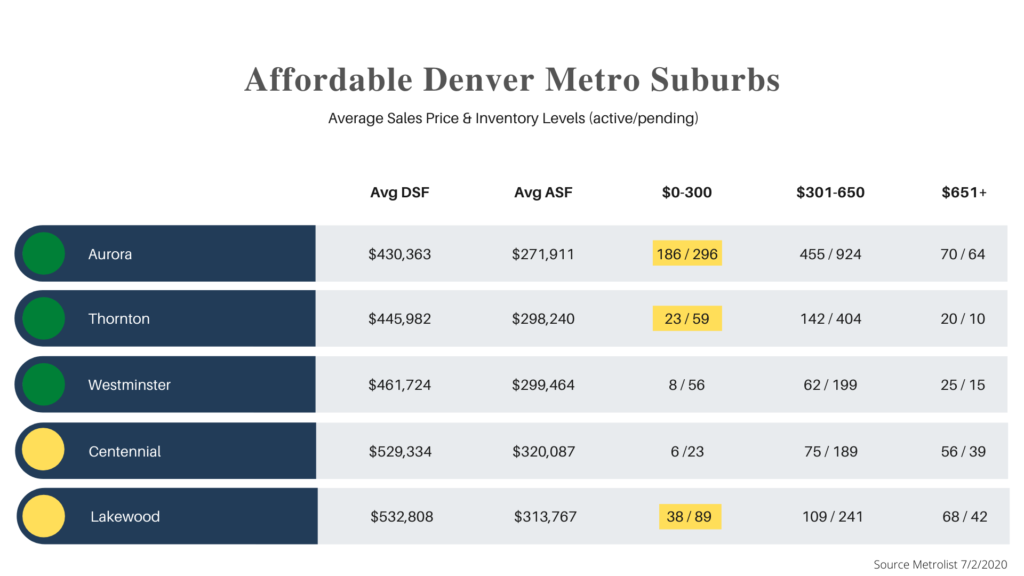
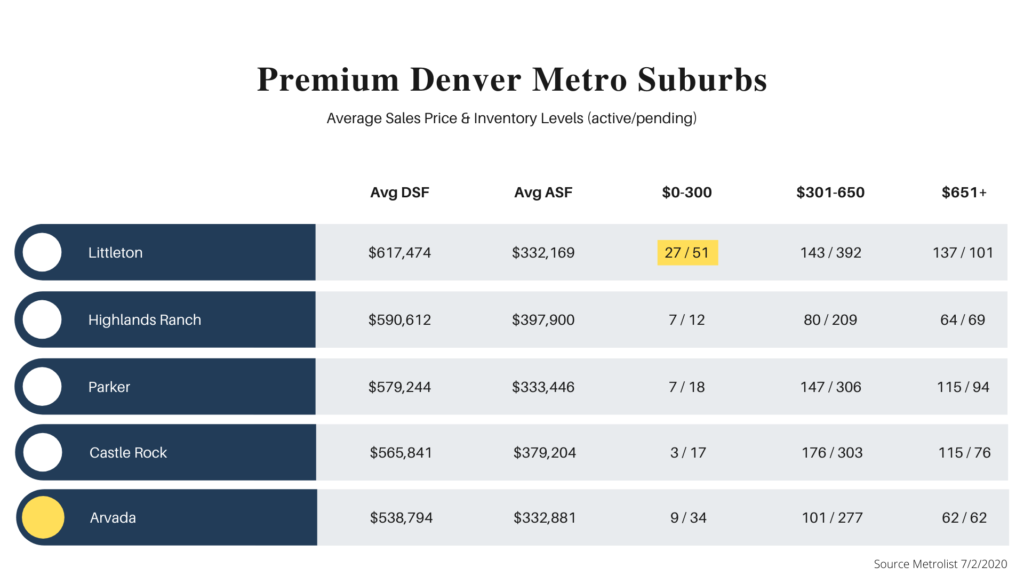
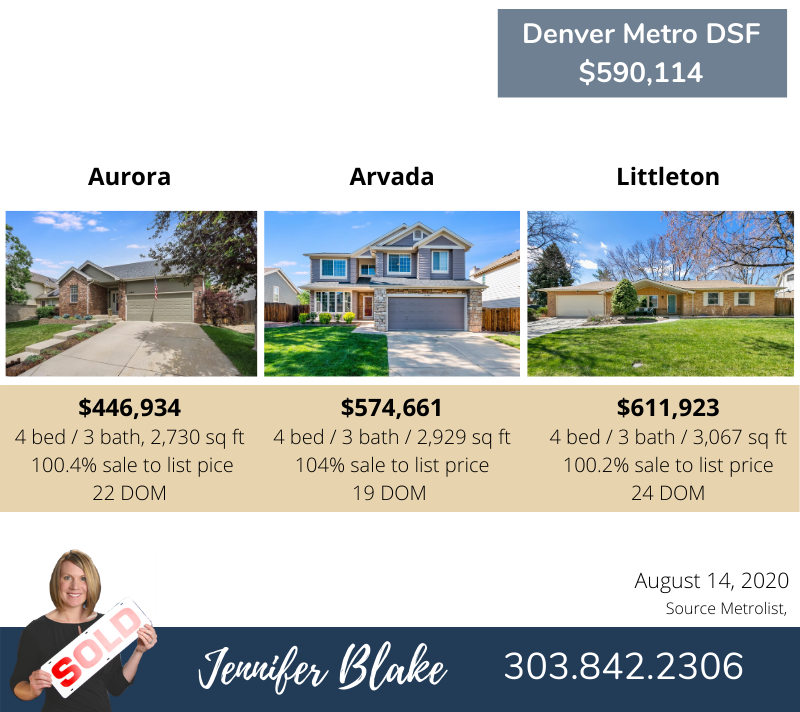
Price is relative to location so let’s so let’s check out what average looks like in 3 popular suburban areas. Starting with detached single family; Aurora is offering some of the best values with the “average” sold home in July coming in nearly $150,000 below the overall metro area. In Littleton on the other hand, you’ll be looking above the overall metro average. And in Arvada you’ll be just below with an average sold home coning in around $575,000.


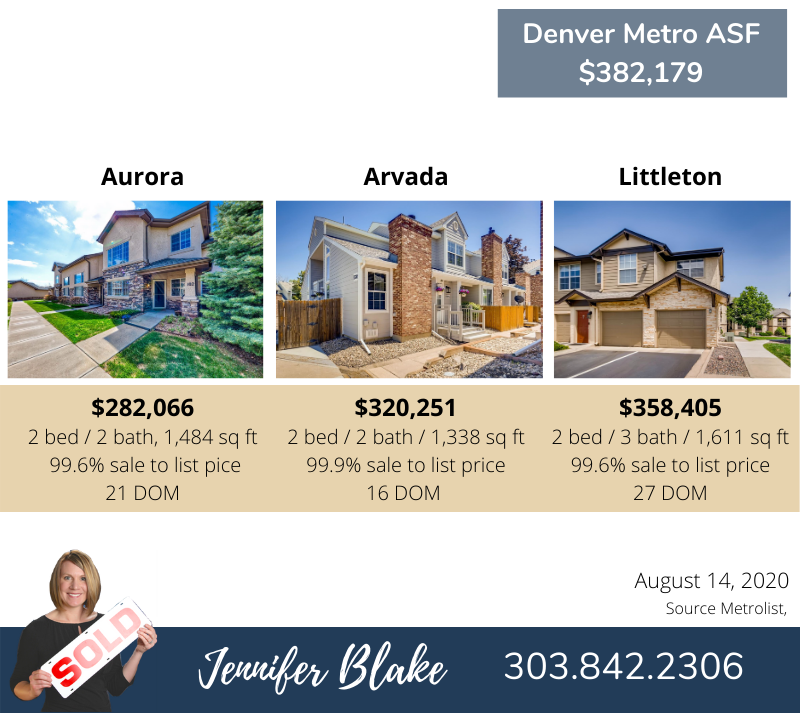
Looking at condos and townhomes; Aurora once again is offering a great value at $100,000 below the overall Denver metro area. Arvada and Littleton are both below the overall metro average as well with condo’s and townhomes selling on average for around $320,000 in Arvada and just under $360,000 in Littleton.

Did I miss a neighborhood or area you’d like more information on? Please reach out and I’d be happy to answer your questions and be of assistance. I look forward to hearing from you to answer your questions and help unlock the home of your dreams!

Denver Market Update

Check out my latest video update to see how high home prices skyrocketed in July and a look at what average looks like in 3 popular areas. Also, find out where an average detached single family home is selling for nearly $150,000 BELOW the overall metro.

Prices & Inventory Levels in 10 Popular Denver Suburbs

Price is relative to the area so let’s check out which popular suburban areas are most affordable to live and where you can expect to pay a premium.  

This slide contains average sales price along with a snap shop of inventory levels by price range for 5 of the most affordable suburban areas.  

Aurora, Thornton and Westminster top the list for most affordable with average detached single family prices nearly $100,000 BELOW the overall metro area.  The areas highlighted in yellow show where the most inventory is available for properties priced below $300,000. Aurora has the most inventory available in both the entry and mid level price points. 

This slide contains a snap shot for 5 of the higher priced suburban areas. 

In all areas demand is greater than supply in the entry and mid level price points. When you start looking at the luxury markets supply and demand is dependent on the area.  

You probably noticed the city of Denver was left off, this was intentional as Denver has some of the highest priced areas and lowest priced areas. If you have questions about specific neighborhoods or areas I didn’t cover please let me know so I can share that information with you. 

July 2020 Market Update

Check out my latest video to see where home prices ended in June and a look at prices and inventory levels in 10 popular suburban areas. Find out which 3 suburban areas are most affordable with average detached single family prices nearly $100,000 below the overall metro area.

FREE Real Estate Updates

How would you like to stay updated on real estate happenings?

Thank you for choosing Jennifer Blake as your real estate resource!

June Market Update

Join my assistant in training and I as we update you on How’s the Market?, where home values ended for May 2020 and 3 reasons why Denver’s real estate market is HOT! HOT! HOT!

Buyer Demand through COVID19

Updated 6/4/2020: This data depicts the number of showings and new contracts each weekend through the various phases of COVID19. It’s important to note that these numbers are based on a Friday to Monday weekend and not a 7 day week. As you can see the Stay at Home Order slowed market activity significantly; however, even when in-person showings weren’t allowed our market was still moving forward. With the return of in-person showings across the Metro area, strong Buyer demand quickly resurfaced.

5/2/2020: This data depicts the number of showings and new contracts each weekend through the various phases of COVID19. It’s important to note that these numbers are based on a Friday to Monday weekend and not a 7 day week. As you can see the Stay at Home Order slowed market activity significantly; however, even when in-person showings weren’t allowed our market was still moving forward. Interestingly enough new contracts have been trending at nearly a 1 to 1 ratio to new listings through March and April. While so far things are still indicating a strong real estate market for the Denver Metro area, the data from the next couple weeks and months is when we’ll see if our market is in for a shift.    

Denver Metro Market Stats March 2020

Market stats reported are Year To Date through March, 31 2020. This data provides a baseline of activity before COVID19 restrictions were put in place. April stats will give us a mix of contracts before and during restrictions and it will be May stats where we truly see the impacts of supply/demand and home values from the COVID19 pandemic .

March data shows: An increase in demand compared to last year, a decrease in supply compared to last year resulting in an increase in home prices.

This info is averaged across the Metro area, some segments of the market are hotter than others! Not everything is flying off the market and anecdotally I’ve noticed the highest demand for homes that are remodeled with the finishes Buyers desire most. The majority of Buyers want a home they can move into with little to no work.

Market Update COVID19 Special Edition #3

In this edition we will review Denver Metro Market stats year to date through March; which real estate activities are currently being considered essential and non-essential; and NEW improvements added this week to the virtual home buying/selling experience.